More Data, Less Signal
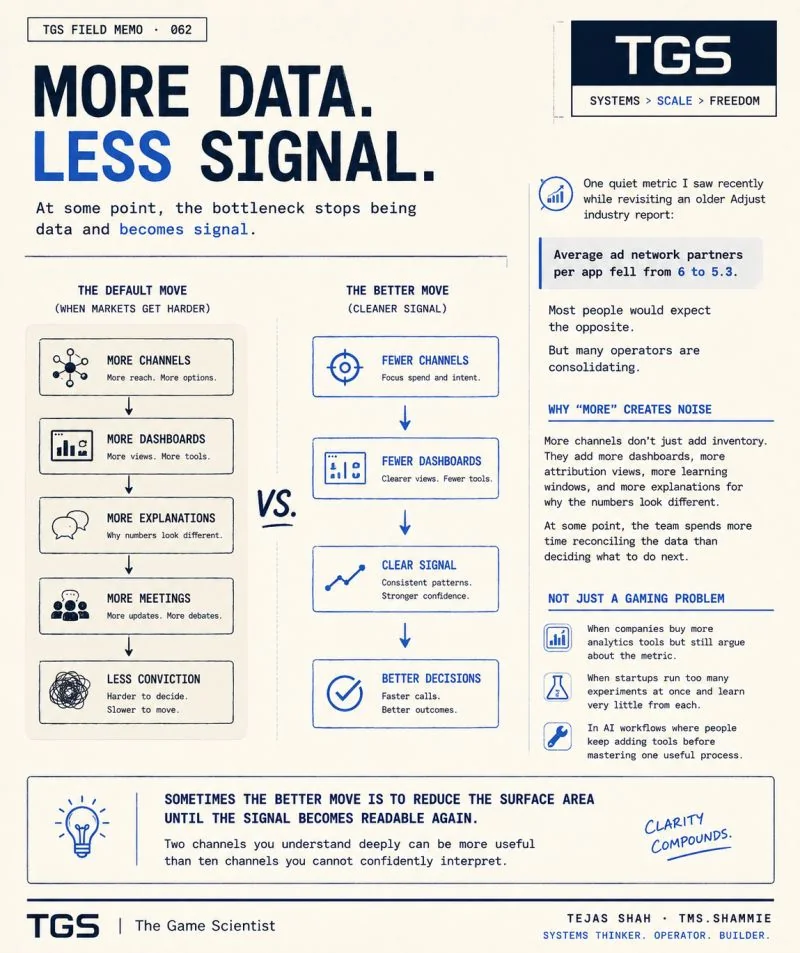
More channels don't just add inventory — they dilute signal until you're reconciling data instead of making decisions.
At some point, the bottleneck stops being data and becomes signal.
One quiet metric from Adjust’s industry benchmarking illustrates this: average ad network partners per app has been declining, settling around 5.3, down from 6. Most people would expect the opposite. When markets get harder — lower download growth, rising CPI, tighter margins — the intuitive response is to diversify. More channels, more reach, more coverage, more experiments.
But average partner counts are falling, not rising. The industry is learning something that runs counter to the diversification instinct.
Why “more” works against you in practice
More ad network partners do not just add inventory. They add more dashboards, more attribution views, more learning windows, more discrepancy reconciliation, and more competing explanations for why the same campaign looks different across platforms.
Each additional channel creates new surface area for the team to manage. SKAdNetwork reporting from one partner. View-through attribution windows that differ from another. Bid floor strategies that interact with your mediation waterfall in ways that aren’t transparent. An incrementality test designed for one channel that may or may not generalize to another.
All of this is legitimate complexity that someone on the team has to understand and maintain. The hidden cost is not the subscription or even the integration overhead. It’s the decision-making cost. At some channel count, the team spends more time reconciling what the data is saying than deciding what to do next.
The result is a paradox: more data points, weaker signal. The numbers are technically there, but the confidence to act on them has been diluted by the volume of competing interpretations.
The pattern shows up everywhere
This is not specific to gaming or to ad networks.
Companies that subscribe to multiple analytics platforms end up in a permanent debate about which tool’s numbers are correct. Each platform has different attribution logic, different session definitions, different sampling approaches. The analytics meeting that was supposed to produce a decision becomes a reconciliation exercise. The decision eventually gets made on judgment — which is what the analytics stack was supposed to replace.
Teams that run too many experiments simultaneously learn very little from each. When three concurrent tests are live and the results don’t explain each other, the most common outcome is a meeting where everyone agrees the data is ambiguous and the tests should run longer. Longer tests overlap with new tests. The learning cycle never closes.
AI workflow adoption shows the same pattern. Teams that subscribe to tools before mastering one useful process end up with a collection of capabilities they’ve never integrated into how work actually happens. The individual tools are good. The stack as a whole produces more overhead than output.
The common thread: at some surface area, you stop gathering intelligence and start generating noise. More data points, but weaker signal at every one of them.
The discipline of reduction
The productive response — which the declining partner count suggests the industry is learning through experience — is to reduce the data surface area until the signal becomes readable again.
Two channels you understand deeply will consistently produce better decisions than ten you can’t confidently interpret. Not because the ten channels contain less inventory, but because the team’s confidence in reading them is too distributed to act on clearly. “Deep understanding” means knowing the audience mechanics, the attribution behavior, the incrementality characteristics, and the creative fatigue curves specific to that channel. That level of understanding takes time and attention that gets spread thin across ten channels.
The same principle applies to analytics tooling: fewer platforms with clear ownership of specific decision types will outperform a sprawling stack where no platform is definitively authoritative on anything. If Platform A answers acquisition questions and Platform B answers engagement questions, you have a workable structure. If both answer both and frequently disagree, you have a reconciliation problem masquerading as an analytics strategy.
What this implies for network and analytics strategy
In practical terms, this means running fewer partners at higher confidence rather than spreading budget across more partners at lower confidence.
It means defining channel ownership clearly: this platform is where we learn about creative performance; this platform is where we scale proven volume; this platform is where we run incrementality tests. One job per channel, not multiple simultaneous hypotheses competing for the same budget and attention.
It means building genuine internal expertise on the channels that matter, rather than distributing attention across every option that might eventually matter.
The question worth asking about your current data infrastructure is not how much data you have access to. It’s how much of what you have you can actually act on with confidence. The gap between those two numbers is where the signal is being lost.
The Ad Yield Optimizer and the UA Spillage calculator on this site are built around this principle — isolating the signal from a specific channel rather than trying to model everything at once. Understanding one number clearly beats reconciling ten numbers indefinitely.