The Scale Ceiling Loop
Every product has a ceiling past which it can't scale. The only way to find it is to push against it deliberately.
Every product has a ceiling past which it can’t scale.
Some can run profitably at $5,000 a day in UA spend. Some can sustain $500,000. Most sit somewhere between those numbers, and the ceiling depends on factors you often can’t control: genre competition, LTV profile, creative fatigue curves, product depth at the margins of your audience. You usually don’t know where your ceiling is until you start pushing against it.
That uncertainty is frustrating from a planning standpoint. But it creates something useful: a diagnostic opportunity that most teams underuse.
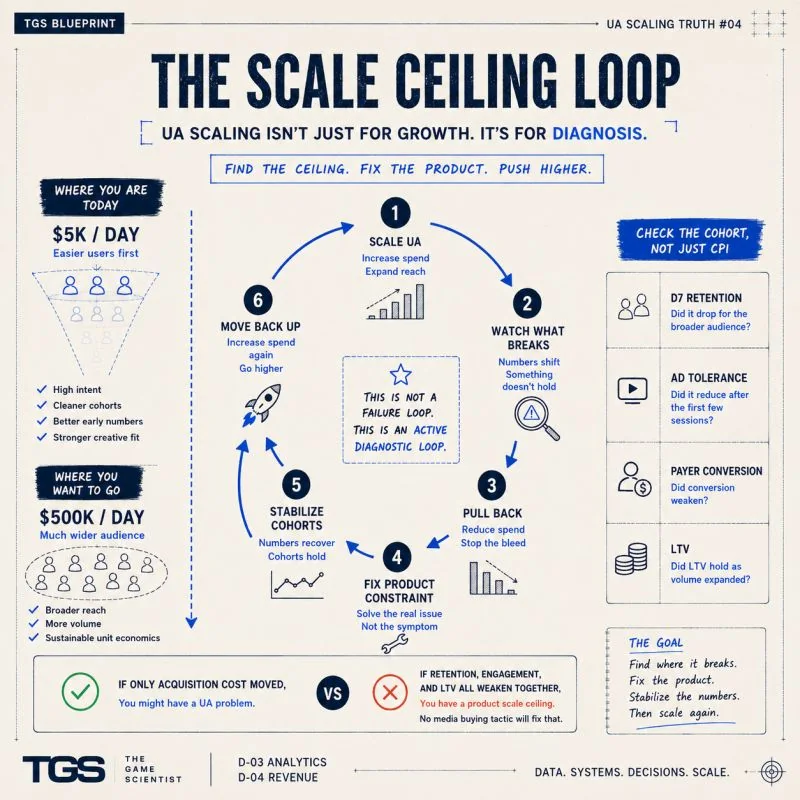
What happens when you scale
When you push UA spend higher, the audience composition changes. You stop finding high-intent users — the ones actively searching for exactly what you made, the ones whose behavioral profiles closely match your best existing cohorts. You start reaching people who are colder, less motivated, and far less forgiving of a weak product experience.
This is where the attribution conversation usually derails. ROAS drops. CPI moves. Retention shifts. The team generates multiple competing theories. UA says the algorithm is underoptimising at higher volume. Product says retention was stable at lower spend. Finance wants to know why the forecasting model isn’t holding.
But in most cases, the campaign hasn’t broken. The product has hit its current ceiling. More media buying sophistication is not going to fix a product constraint. It will briefly obscure it.
The UA-as-diagnosis framing
Here’s the reframe: spending into a ceiling is one of the most efficient ways to find out what’s wrong with a product.
The reason is that scale pressure is a stress test. At low volume, you’re mostly acquiring self-selecting users — people who would have found the product anyway, who fit the demographic the creative was designed for, who have a high tolerance for rough edges because they’re intrinsically motivated. These users absorb a lot of product deficiencies without registering them clearly in the data.
At high volume, you lose that insulation. The colder audience finds the friction. The weak second session. The mid-game pacing drop. The monetization ask that comes too early. The onboarding that assumes more context than most users have. All of it becomes visible in the cohort data in a way it wasn’t at lower volume.
This makes deliberate scaling a diagnostic tool: push spend until the numbers move in ways you didn’t expect, identify what specifically changed in the cohorts, pull back, fix the identified constraint, stabilize, and push again.
Reading the data correctly
The key is looking at the right cut. Most scaling post-mortems focus on CPI because it’s the number that moved most visibly. But CPI movement is usually a lagging signal of a product problem, not the leading one.
The earlier signals are in the cohort metrics:
D7 retention for the incremental audience. Did it drop for users acquired during the high-spend period, relative to the month prior? If yes, the product is not holding the broader audience. That’s a product constraint, not a UA constraint.
Ad tolerance after the first few sessions. Do users from high-spend periods show earlier ad opt-out or lower session depth at D3–D5? If yes, the product is relying too much on front-loaded engagement that doesn’t persist into the colder audience’s behavior pattern.
Payer conversion rate by spend level. Does conversion into the monetization flow weaken as volume rises? If yes, the product’s monetization entry points may be calibrated for a segment of users that doesn’t represent the broader audience.
LTV stability as volume expands. Does projected 90-day LTV hold as spend goes up, or does it compress? LTV compression under scaling almost always indicates a product depth problem — the new audience finds less value in the core loop, so they spend less and churn faster.
If only CPI moved and the cohort metrics held, you have a UA efficiency problem. Better targeting, creative iteration, and bid strategy will address it.
If retention, engagement, and LTV all weakened together, you have a product ceiling. The spend level revealed it. No amount of media buying optimization will raise the ceiling — only product work will.
The loop
The practical framework is three moves, repeated:
Push: scale UA above your comfortable range. Define “uncomfortable” as the level where you genuinely don’t know if the unit economics will hold.
Read: when the numbers move, read the cohort metrics — not just CPI. Identify what specifically changed. UA problem or product constraint?
Fix: if it’s a product problem, pull back spend to the range where economics are stable, fix the identified constraint, let the metrics stabilize. If it’s a UA efficiency problem, address the targeting and creative layer without touching product.
Then push again.
The teams that compound the fastest on growth are the ones that treat this loop as a structured process rather than an emergency response. The ceiling stops being a surprise when you’re using it as a diagnostic. Each time you find it and fix what caused it, the ceiling moves.
The scaling data you collect during the push is some of the most useful product feedback you can get. The audience that breaks your product at high volume is exactly the audience you need to design for if you want to grow past where you currently are.
The ceiling is not a wall. It’s a feedback loop.
For the spend-side analysis — specifically the bid caps and runway exposure that determine how far you can push before the risk profile changes — the Bid Runway Calculator models this directly. Understanding the ceiling is the strategic question; understanding how much capital you’re exposing during the push is the operational one.